如何用R创建powerpoint报告
本文将通过展示我们如何使用officer 来创建PowerPoint报表。
入门
让我们从加载officer开始。
library(officer)
接下来,我们将使用read_pptx函数在R中创建PowerPoint对象。
pres <- read_pptx()
要添加一张幻灯片,我们使用add_slide函数。 我们将创建的第一张幻灯片是标题幻灯片。 我们在layout参数中指定幻灯片的类型。 这里还有其他几种可能,包括“标题和内容”,“空白”,“仅标题”,“比较”,“两个内容”和“部分标题”。
其次,我们使用ph_with添加标题文本。
# add title slide
pres <- add_slide(pres, layout = "Title Only", master = "Office Theme")

# add Title text
pres <- ph_with(pres, value = "My first presentation", location = ph_location_type(type = "title"))
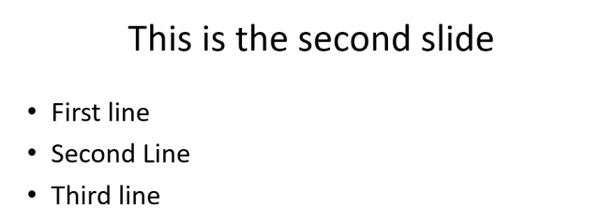
接下来,让我们添加另一张幻灯片。 这次我们将有一个标题和内容。
pres <- add_slide(pres, layout = "Title and Content", master = "Office Theme")
pres <- ph_with(pres, value = "This is the second slide", location = ph_location_type(type = "title"))
pres <- ph_with(pres, value = c("First line", "Second Line", "Third line"), location = ph_location_type(type = "body"))
如何添加表格
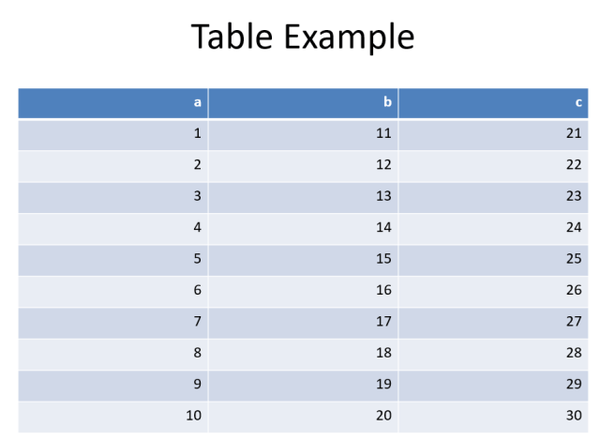
现在,如果我们要添加表怎么办? 让我们创建一个示例数据框并将其添加到新幻灯片中。 同样,我们将使用ph_with将内容(在这种情况下为数据框)添加到新幻灯片中。 这次我们只需要将value参数设置为等于我们的数据框对象。
# create sample data frame
frame <- data.frame(a = 1:10, b = 11:20, c = 21:30)

# create slide to hold table
pres <- add_slide(pres, layout = "Title and Content", master = "Office Theme")
pres <- ph_with(pres, value = "Table Example", location = ph_location_type(type = "title"))

# add data frame to PowerPoint slide
pres <- ph_with(pres, value = frame, location = ph_location_type(type = "body"))
添加图和图像
绘图和图像也可以添加到PowerPoint文档中。 在下面的代码中,我们将ggplot对象添加到新幻灯片中。
library(ggplot2)
pres <- add_slide(pres, layout = "Blank", master = "Office Theme")
sample_plot <- ggplot(data = frame)   geom_point(mapping = aes(1:10, a),
                                      size = 3)   theme_minimal()

pres <- ph_with(pres, value = sample_plot, location = ph_location_fullsize())
外部图像可以这样加载:
pres <- add_slide(pres)
pres <- ph_with(pres, external_img("sample_image.png", width = 2, height = 3),
location = ph_location_type(type = "body"), use_loc_size = FALSE )请注意,在这种情况下,如何将图像文件的名称以及所需的宽度和高度大小包装在external_img函数中。
调整字体和颜色
字体大小和颜色可以使用fp_text函数进行调整。 在下面的示例中,我们创建了两个段落–第一个段落为粗体,第二个段落为绿色。
# create bold text object with size 24 font
bold <- fp_text(font.size = 24, bold = TRUE)

# create green Arial text object with size 24 font
green <- fp_text(font.size = 24, color = "green", font.family = "Arial")

# create block list of two paragraphs with the above font specifics
pars <- block_list(fpar(ftext("This line is bold", bold)), fpar(ftext("This line is green and Arial", green)))

# add slide with paragraphs
pres % ph_with(pars, location = ph_location_type(type = "body"))
添加超链接
最后,我们可以使用ph_hyperlink函数将超链接添加到演示文稿中。 在下面,我们创建一个带有文本“ Click Here”的超链接,该链接指向https://theautomatic.net。
pres <- add_slide(pres)

pres <- ph_with(pres, "Click Here", location = ph_location_type(type = "body"))
pres <- ph_hyperlink(pres, href = "https://theautomatic.net")
赞 (0)


